i.score
This data is from this publication (GEO number: GSE156246 and PMID: 34911733)
This is a how to guide to run i.score function in iCellR and to reproduce the above published data for G0 and non G0 cells.
Download the sample iCellR objects (used in the publication) from here: https://genome.med.nyu.edu/results/external/iCellR/i.score/ (my.obj@raw.data in these objects are log normalized)
Download sample gene signatures from here: https://genome.med.nyu.edu/results/external/iCellR/i.score/gene_signatures.tar.gz (gene signatures used in the publication are in the supplementary data of the paper)
# load sample gene signature that are in iCellR
# (these cell cycle signatures are from here: https://www.nature.com/articles/s41586-019-1884-x)

library(iCellR)
G0 <- readLines(system.file('extdata', 'G0.txt', package = 'iCellR'))
G1S <- readLines(system.file('extdata', 'G1S.txt', package = 'iCellR'))
G2M <- readLines(system.file('extdata', 'G2M.txt', package = 'iCellR'))
M <- readLines(system.file('extdata', 'M.txt', package = 'iCellR'))
MG1 <- readLines(system.file('extdata', 'MG1.txt', package = 'iCellR'))
S <- readLines(system.file('extdata', 'S.txt', package = 'iCellR'))

# load all the gene signatures

Melnick_10_GILMORE_CORE_NFKB_PATHWAY.txt <- readLines("10_GILMORE_CORE_NFKB_PATHWAY.txt")
Melnick_11_HALLMARK_MYC_TARGETS_V1.txt <- readLines("11_HALLMARK_MYC_TARGETS_V1.txt")
Melnick_12_GO_BETA_CATENIN_BINDING.txt <- readLines("12_GO_BETA_CATENIN_BINDING.txt")
Melnick_13_PID_BETA_CATENIN_NUC_PATHWAY.txt <- readLines("13_PID_BETA_CATENIN_NUC_PATHWAY.txt")
Melnick_14_PID_WNT_SIGNALING_PATHWAY.txt <- readLines("14_PID_WNT_SIGNALING_PATHWAY.txt")
Melnick_15_PID_WNT_CANONICAL_PATHWAY.txt <- readLines("15_PID_WNT_CANONICAL_PATHWAY.txt")
Melnick_16_Pribluda_SENESCENCE_INFLAMMATORY_GENES.txt <- readLines("16_Pribluda_SENESCENCE_INFLAMMATORY_GENES.txt")
Melnick_17_FRIDMAN_SENESCENCE_DN.txt <- readLines("17_FRIDMAN_SENESCENCE_DN.txt")
Melnick_18_FRIDMAN_SENESCENCE_UP.txt <- readLines("18_FRIDMAN_SENESCENCE_UP.txt")
Melnick_19_DeJONGE_LSC_TOP50_genes.txt <- readLines("19_DeJONGE_LSC_TOP50_genes.txt")
Melnick_1_AML1566_AraC_UP.txt <- readLines("1_AML1566_AraC_UP.txt")
Melnick_20_GAL_LEUKEMIC_STEM_CELL_UP.txt <- readLines("20_GAL_LEUKEMIC_STEM_CELL_UP.txt")
Melnick_21_GAL_LEUKEMIC_STEM_CELL_DN.txt <- readLines("21_GAL_LEUKEMIC_STEM_CELL_DN.txt")
Melnick_22_EPPERT_CE_HSC_LSC.txt <- readLines("22_EPPERT_CE_HSC_LSC.txt")
Melnick_23_JAATINEN_HEMATOPOIETIC_STEM_CELL_UP.txt <- readLines("23_JAATINEN_HEMATOPOIETIC_STEM_CELL_UP.txt")
Melnick_24_JAATINEN_HEMATOPOIETIC_STEM_CELL_DN.txt <- readLines("24_JAATINEN_HEMATOPOIETIC_STEM_CELL_DN.txt")
Melnick_25_INFLAMMATORY_RESPONSE.txt <- readLines("25_INFLAMMATORY_RESPONSE.txt")
Melnick_26_RAMALHO_STEMNESS_DN.txt <- readLines("26_RAMALHO_STEMNESS_DN.txt")
Melnick_27_RAMALHO_STEMNESS_UP.txt <- readLines("27_RAMALHO_STEMNESS_UP.txt")
Melnick_28_REACTOME_REGULATION_OF_MITOTIC_CELL_CYCLE.txt <- readLines("28_REACTOME_REGULATION_OF_MITOTIC_CELL_CYCLE.txt")
Melnick_2_AML1566_AraC_DN.txt <- readLines("2_AML1566_AraC_DN.txt")
Melnick_3_DUY_CISG_UP.txt <- readLines("3_DUY_CISG_UP.txt")
Melnick_4_DUY_CISG_DN.txt <- readLines("4_DUY_CISG_DN.txt")
Melnick_5_DIAPAUSE_UP_BOROVIAK.txt <- readLines("5_DIAPAUSE_UP_BOROVIAK.txt")
Melnick_6_BOROVIAK_DIAPAUSE_DN.txt <- readLines("6_BOROVIAK_DIAPAUSE_DN.txt")
Melnick_7_SASP_COPPE.txt <- readLines("7_SASP_COPPE.txt")
Melnick_8_SALDIVAR_ATR_SUPPRESSED_TARGETS.txt <- readLines("8_SALDIVAR_ATR_SUPPRESSED_TARGETS.txt")
Melnick_9_BIOCARTA_NFKB_PATHWAY.txt <- readLines("9_BIOCARTA_NFKB_PATHWAY.txt")
diapause_neg.txt <- readLines("diapause_neg.txt")
diapause_pos_and_neg.txt <- readLines("diapause_pos_and_neg.txt")
diapause_pos.txt <- readLines("diapause_pos.txt")
DTP_sig_150_Down.txt <- readLines("DTP_sig_150_Down.txt")
DTP_sig_150_up.txt <- readLines("DTP_sig_150_up.txt")
Lum_uniq_down.txt <- readLines("Lum_uniq_down.txt")
Lum_uniq_up.txt <- readLines("Lum_uniq_up.txt")
Mes_uniq_down.txt <- readLines("Mes_uniq_down.txt")
Mes_uniq_up.txt <- readLines("Mes_uniq_up.txt")
panDTP_DN.txt <- readLines("new_panDTP_DN.txt")
panDTP_up.txt <- readLines("new_panDTP_up.txt")
mes_DTP_included_DEG_DN.txt <- readLines("new_mes_DTP_included_DEG_DN.txt")
mes_DTP_included_DEG_UP.txt <- readLines("new_mes_DTP_included_DEG_UP.txt")
lum_DTP_included_DEG_DN.txt <- readLines("new_lum_DTP_included_DEG_DN.txt")
lum_DTP_included_DEG_UP.txt <- readLines("new_lum_DTP_included_DEG_UP.txt")
lum_DTP_specific_UP_noCC.txt <- readLines("new_lum_DTP_specific_UP_noCC_.txt")
mes_DTP_specific_UP_noCC.txt <- readLines("new_mes_DTP_specific_UP_noCC_.txt")
Group all the signatures in one character object:
All <- c("Melnick_10_GILMORE_CORE_NFKB_PATHWAY.txt","Melnick_11_HALLMARK_MYC_TARGETS_V1.txt","Melnick_12_GO_BETA_CATENIN_BINDING.txt","Melnick_13_PID_BETA_CATENIN_NUC_PATHWAY.txt","Melnick_14_PID_WNT_SIGNALING_PATHWAY.txt","Melnick_15_PID_WNT_CANONICAL_PATHWAY.txt","Melnick_16_Pribluda_SENESCENCE_INFLAMMATORY_GENES.txt","Melnick_17_FRIDMAN_SENESCENCE_DN.txt","Melnick_18_FRIDMAN_SENESCENCE_UP.txt","Melnick_19_DeJONGE_LSC_TOP50_genes.txt","Melnick_1_AML1566_AraC_UP.txt","Melnick_20_GAL_LEUKEMIC_STEM_CELL_UP.txt","Melnick_21_GAL_LEUKEMIC_STEM_CELL_DN.txt","Melnick_22_EPPERT_CE_HSC_LSC.txt","Melnick_23_JAATINEN_HEMATOPOIETIC_STEM_CELL_UP.txt","Melnick_24_JAATINEN_HEMATOPOIETIC_STEM_CELL_DN.txt","Melnick_25_INFLAMMATORY_RESPONSE.txt","Melnick_26_RAMALHO_STEMNESS_DN.txt","Melnick_27_RAMALHO_STEMNESS_UP.txt","Melnick_28_REACTOME_REGULATION_OF_MITOTIC_CELL_CYCLE.txt","Melnick_2_AML1566_AraC_DN.txt","Melnick_3_DUY_CISG_UP.txt","Melnick_4_DUY_CISG_DN.txt","Melnick_5_DIAPAUSE_UP_BOROVIAK.txt","Melnick_6_BOROVIAK_DIAPAUSE_DN.txt","Melnick_7_SASP_COPPE.txt","Melnick_8_SALDIVAR_ATR_SUPPRESSED_TARGETS.txt","Melnick_9_BIOCARTA_NFKB_PATHWAY.txt","diapause_neg.txt","diapause_pos_and_neg.txt","diapause_pos.txt","DTP_sig_150_Down.txt","DTP_sig_150_up.txt","Lum_uniq_down.txt","Lum_uniq_up.txt","Mes_uniq_down.txt","Mes_uniq_up.txt","G0","G1S","G2M","M","MG1","S","panDTP_DN.txt","panDTP_up.txt","mes_DTP_included_DEG_DN.txt","mes_DTP_included_DEG_UP.txt","lum_DTP_included_DEG_DN.txt","lum_DTP_included_DEG_UP.txt","lum_DTP_specific_UP_noCC.txt","mes_DTP_specific_UP_noCC.txt")Load your sample iCellR object
load("BT474_DTP.Robj")Score for cell cycle gene signatures with any of the following scoring methods: tirosh, mean, sum, gsva, ssgsea, zscore and plage. (tirosh and zscore methods are recommended to perform best)
dat1 <- i.score(my.obj, scoring.List = c("G0","G1S","G2M","M","MG1","S") ,scoring.method = "tirosh",return.stats = TRUE, data.type = "raw.data")
write.table(dat1,"tirosh_G0.tsv",sep="\t")
Score for all the other signatures (tirosh, mean, sum, gsva, ssgsea, zscore and plage)
dat2 <- i.score(my.obj, scoring.List = All ,scoring.method = "tirosh",return.stats = TRUE, data.type = "raw.data")
write.table(dat2,"tirosh_all.tsv",sep="\t")
Prepare data to plot (marge dat1 and dat2)
dir.create("boxplots_tirosh")
setwd("boxplots_tirosh")

data <- read.table("../tirosh_all.tsv",sep="\t",header=T)
dataCC <- read.table("../tirosh_G0.tsv",sep="\t",header=T)

df = as.character(dataCC$assignment.annotation) == "G0"
df[ df == "TRUE" ] <- "GO"
df[ df == "FALSE" ] <- "nonGO"

data <- cbind(cond = rep("sample",length(df)),
    ID = rownames(data),
    assignment.annotation = dataCC$assignment.annotation,
    GO_nonGO = df,
    data)

write.table((data),file="data.xls",sep="\t", row.names =F)
Plot all the signatures individually:
data <- read.table("data.xls",sep="\t",header=T)
g <- head(data)[5:55]
g <- colnames(g)
library(ggpubr)
for(i in g){
name <- paste("boxplot_",i,".png",sep="")
png(name,width = 6, height = 4, units = 'in', res = 300)
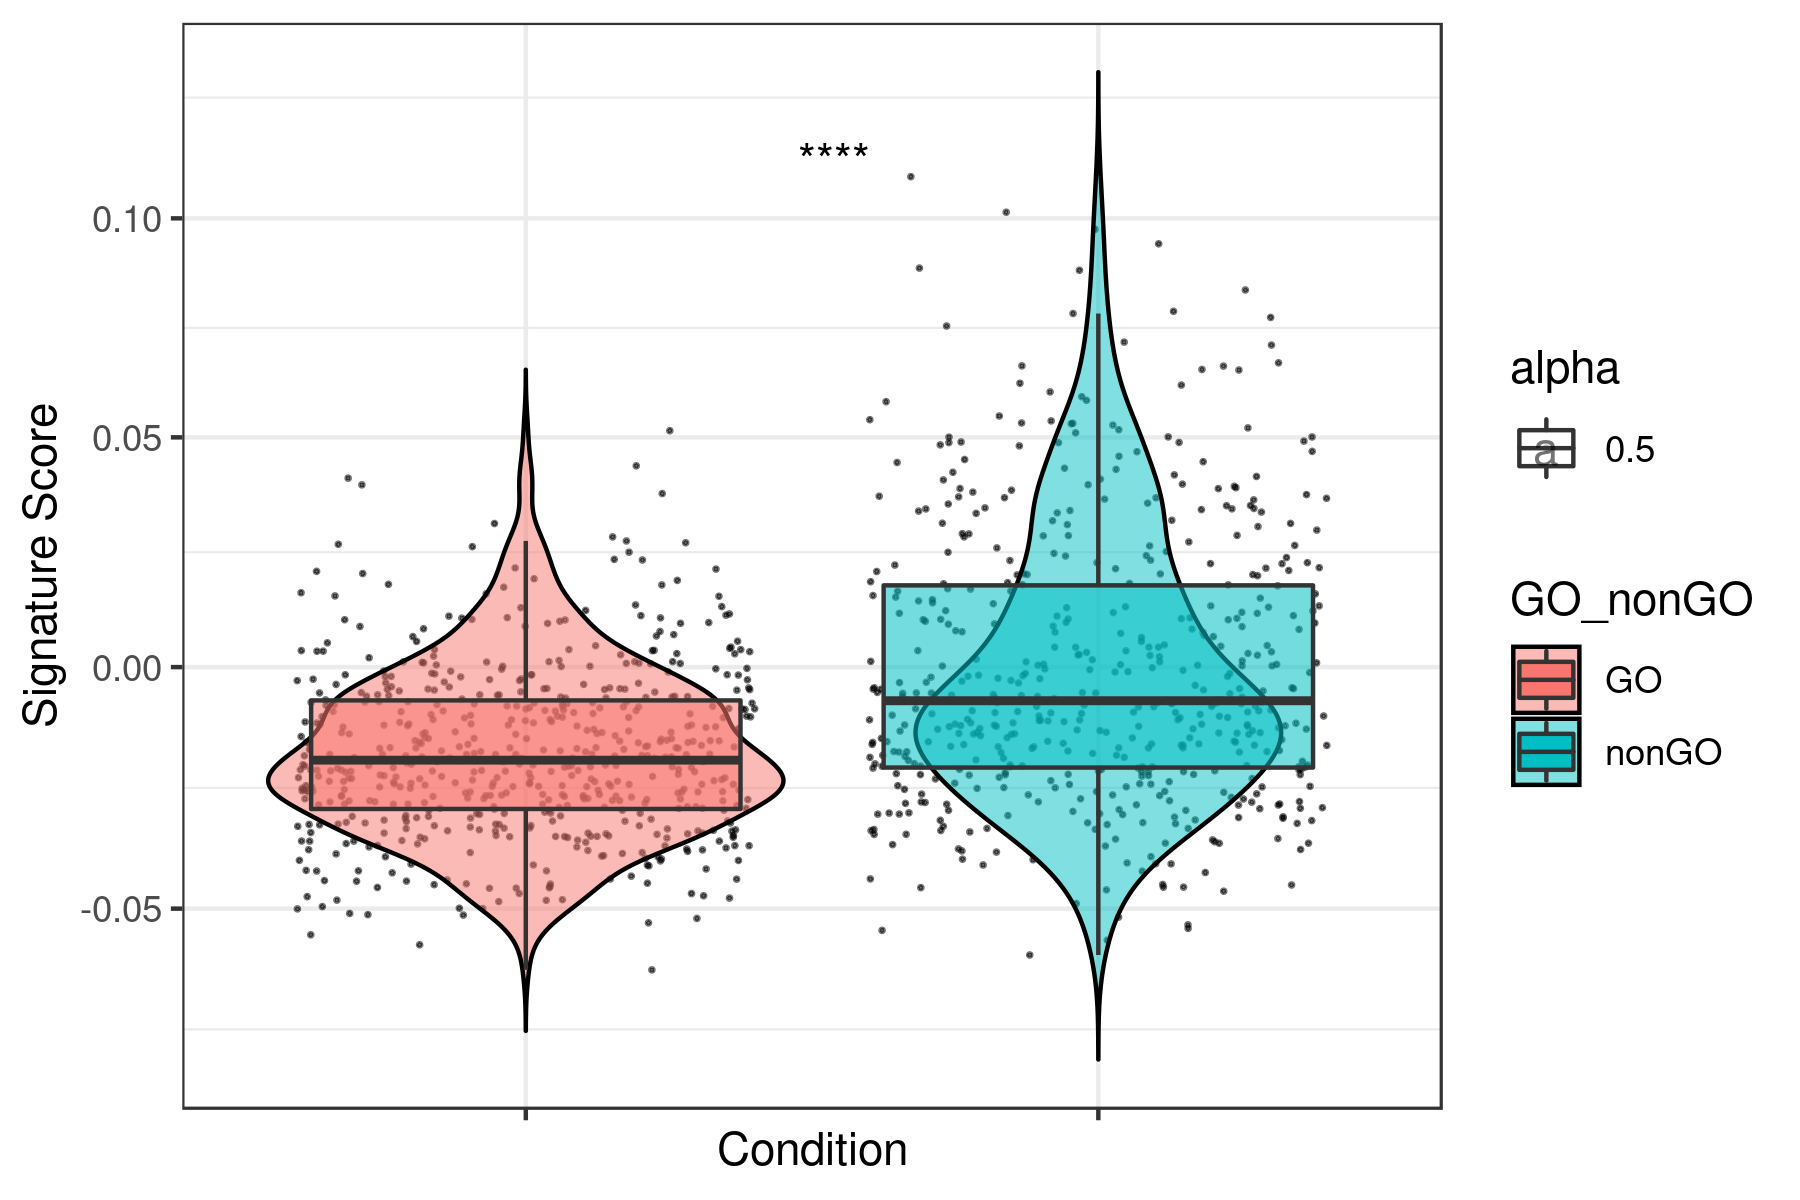
print(ggplot(data, aes(x= GO_nonGO,y=data[, i],fill = GO_nonGO, alpha = 0.5)) +
geom_jitter(size = 0.2, color="black") +
geom_violin(trim=FALSE, col = "black", alpha = 0.5) +
geom_boxplot(outlier.color = NA) +
theme_bw() +
xlab("Condition") +
ylab("Signature Score") +
scale_y_continuous(trans = "log1p") +
stat_compare_means(aes(group = GO_nonGO), label = "p.signif", label.x = 1.5) +
theme(axis.text.x = element_blank()))
dev.off()
}Example for "lum_DTP_included_DEG_DN.txt"
To see all the plots made as above go to this link: https://genome.med.nyu.edu/results/external/iCellR/i.score/test/boxplots_tirosh/